Made with Tertin · 5 slides
HarborDesk Quarterly Operating Review
Five slides reviewing a fictional support operation through ticket demand, resolution time, survey responses and a four-week operating experiment.
Published
About this example
HarborDesk and its operating figures are fictional. The quarter shows 3,180 tickets, with separate count and hour charts and explicit survey denominators. Trends describe the invented example without claiming causation. Actions and target gates are proposed, not proven improvements or forecasts.
Reviewed example created with Tertin. Copyedited for publication.
Open the reviewed presentation
Open or download the reviewed HTML presentation to inspect the slides in your browser. The published slide previews were rendered from this reviewed copy.
Every slide, with its text
Open a preview to see it at full size. Read the text from the published presentation beside each image to explore the content as well as the design.
1. More demand, faster resolution.
Text from the published presentation
HARBORDESK / OPERATING REVIEW / Q3
Fictional demonstration
01 / QUARTERLY SIGNAL
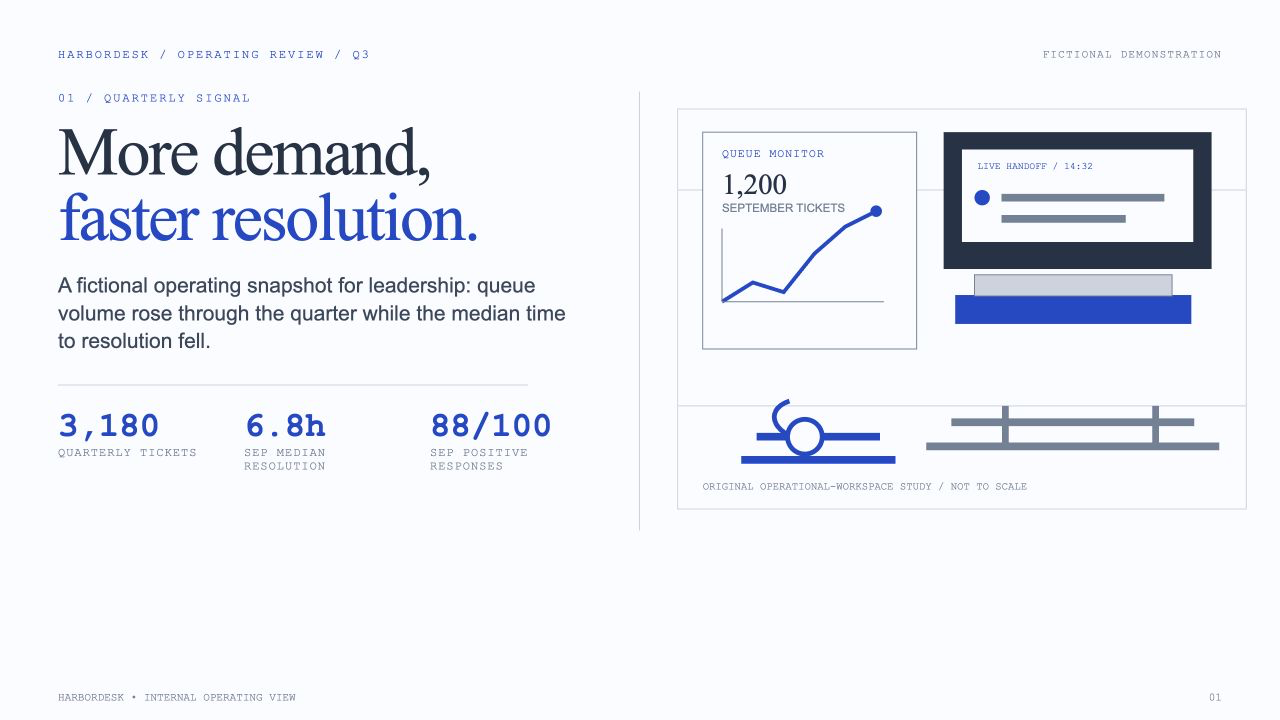
More demand,
faster resolution.
A fictional operating snapshot for leadership: queue volume rose through the quarter while the median time to resolution fell.
3,180
Quarterly tickets
6.8h
Sep median resolution
88/100
Sep positive responses
QUEUE MONITOR1,200SEPTEMBER TICKETSLIVE HANDOFF / 14:32ORIGINAL OPERATIONAL-WORKSPACE STUDY / NOT TO SCALE
HARBORDESK • INTERNAL OPERATING VIEW01
2. Resolution improved as volume rose
Text from the published presentation
02 / VOLUME + SPEED
Fictional demonstration
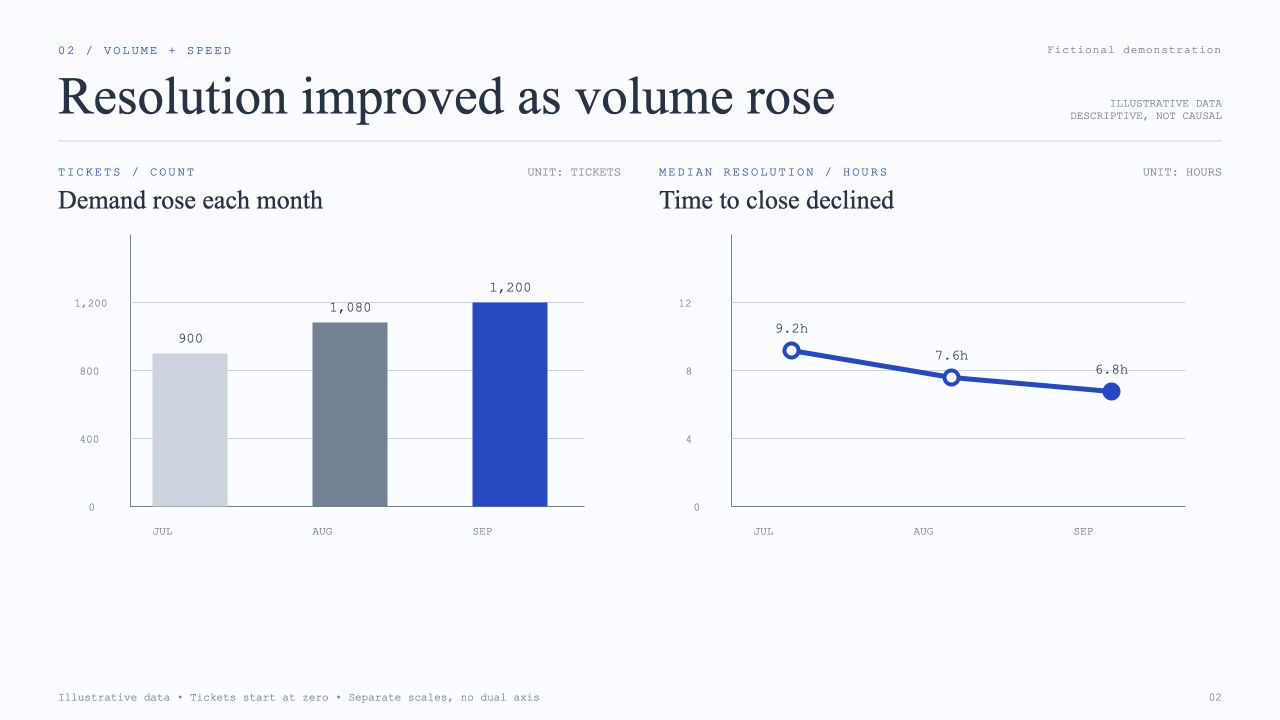
Resolution improved as volume rose
ILLUSTRATIVE DATA
DESCRIPTIVE, NOT CAUSAL
TICKETS / COUNT
Demand rose each month
UNIT: TICKETS
04008001,200JULAUGSEP9001,0801,200
MEDIAN RESOLUTION / HOURS
Time to close declined
UNIT: HOURS
04812JULAUGSEP9.2h7.6h6.8h
Illustrative data • Tickets start at zero • Separate scales, no dual axis02
3. Satisfaction moved in the same direction
Text from the published presentation
03 / CUSTOMER SIGNAL
Fictional demonstration
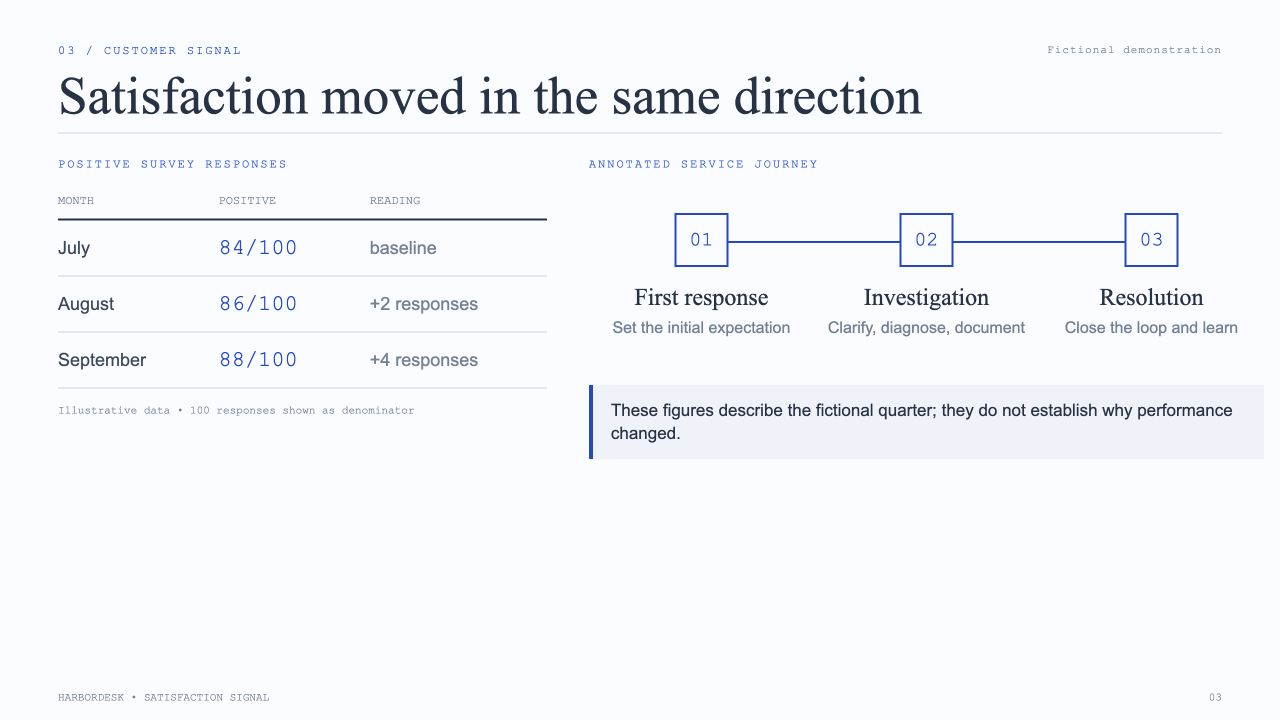
Satisfaction moved in the same direction
POSITIVE SURVEY RESPONSES
MONTH
POSITIVE
READING
July
84/100
baseline
August
86/100
+2 responses
September
88/100
+4 responses
Illustrative data • 100 responses shown as denominator
ANNOTATED SERVICE JOURNEY
01
First response
Set the initial expectation
02
Investigation
Clarify, diagnose, document
03
Resolution
Close the loop and learn
These figures describe the fictional quarter; they do not establish why performance changed.
HARBORDESK • SATISFACTION SIGNAL03
4. Protect quality at the busiest handoff
Text from the published presentation
04 / OPERATING DESIGN
Fictional demonstration
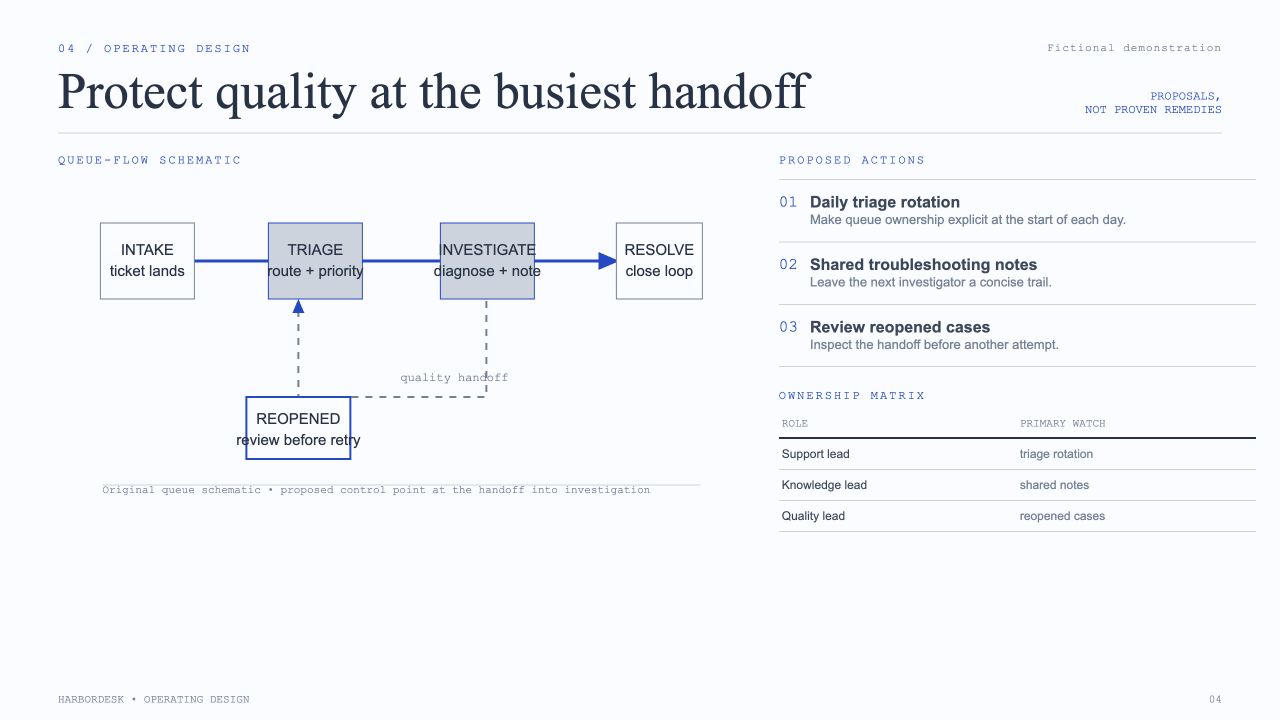
Protect quality at the busiest handoff
PROPOSALS,
NOT PROVEN REMEDIES
QUEUE-FLOW SCHEMATIC
INTAKEticket landsTRIAGEroute + priorityINVESTIGATEdiagnose + noteRESOLVEclose loopREOPENEDreview before retryquality handoffOriginal queue schematic • proposed control point at the handoff into investigation
PROPOSED ACTIONS
01
Daily triage rotation
Make queue ownership explicit at the start of each day.
02
Shared troubleshooting notes
Leave the next investigator a concise trail.
03
Review reopened cases
Inspect the handoff before another attempt.
OWNERSHIP MATRIX
ROLE
PRIMARY WATCH
Support lead
triage rotation
Knowledge lead
shared notes
Quality lead
reopened cases
HARBORDESK • OPERATING DESIGN04
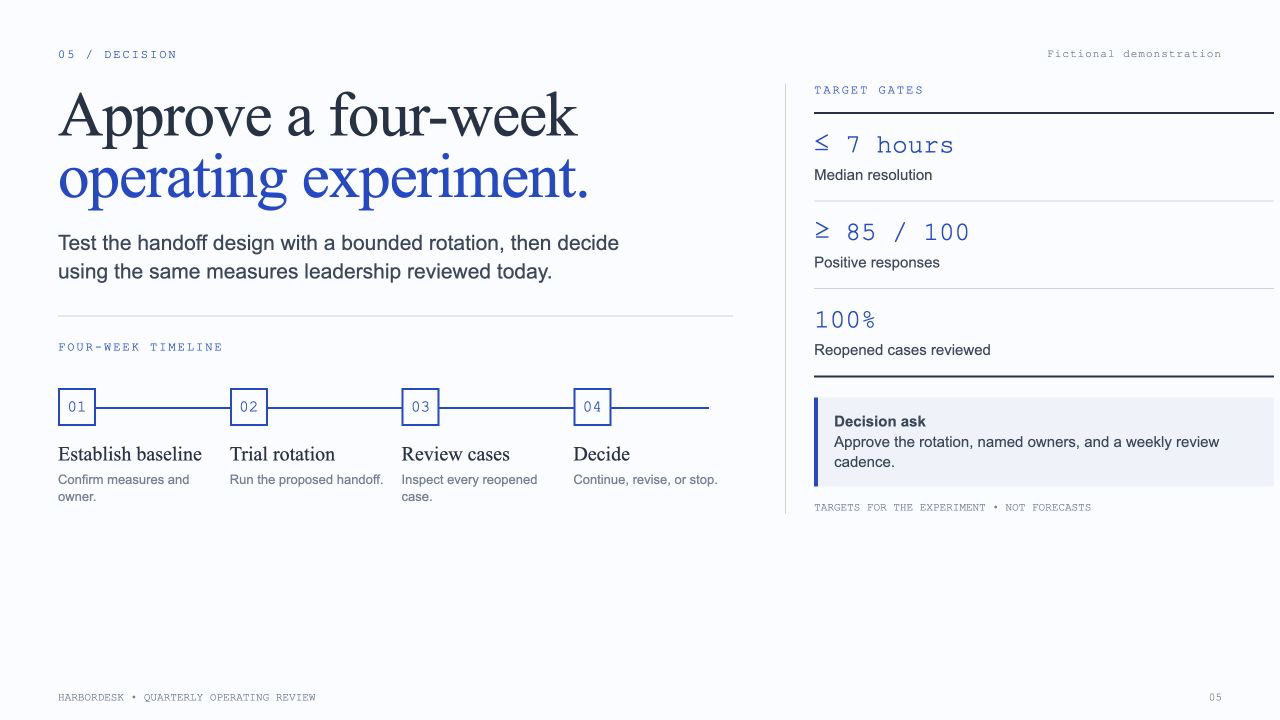
5. Approve a four-week operating experiment.
Text from the published presentation
05 / DECISION
Fictional demonstration
Approve a four-week
operating experiment.
Test the handoff design with a bounded rotation, then decide using the same measures leadership reviewed today.
FOUR-WEEK TIMELINE
01
Establish baseline
Confirm measures and owner.
02
Trial rotation
Run the proposed handoff.
03
Review cases
Inspect every reopened case.
04
Decide
Continue, revise, or stop.
TARGET GATES
≤ 7 hours
Median resolution
≥ 85 / 100
Positive responses
100%
Reopened cases reviewed
Decision ask
Approve the rotation, named owners, and a weekly review cadence.
TARGETS FOR THE EXPERIMENT • NOT FORECASTS
HARBORDESK • QUARTERLY OPERATING REVIEW05